Chart Patterns
Charts are a visual representation of a stock's price movement over time.
Introduction to Chart Patterns, Support, and Resistance
Chart patterns are visual representations of price movements that can provide clues about potential future price trends. They are often used in technical analysis to identify opportunities for buying or selling securities.
Support and resistance are key concepts in chart analysis. They refer to price levels where a security's price has historically struggled to break through.
Support
A price level where a stock's price has historically found support and has been unlikely to fall below. When a stock's price approaches a support level, it may bounce back up.
Resistance
A price level where a stock's price has historically encountered resistance and has been unlikely to rise above. When a stock's price approaches a resistance level, it may fall back down.
By understanding chart patterns, support, and resistance, you can enhance your ability to identify potential trading opportunities and manage risk.
Head and Shoulders
The head and shoulders pattern is a chart pattern that can signal a potential reversal from a bullish trend to a bearish trend. It's named after its shape, which resembles a head with two smaller shoulders on either side.
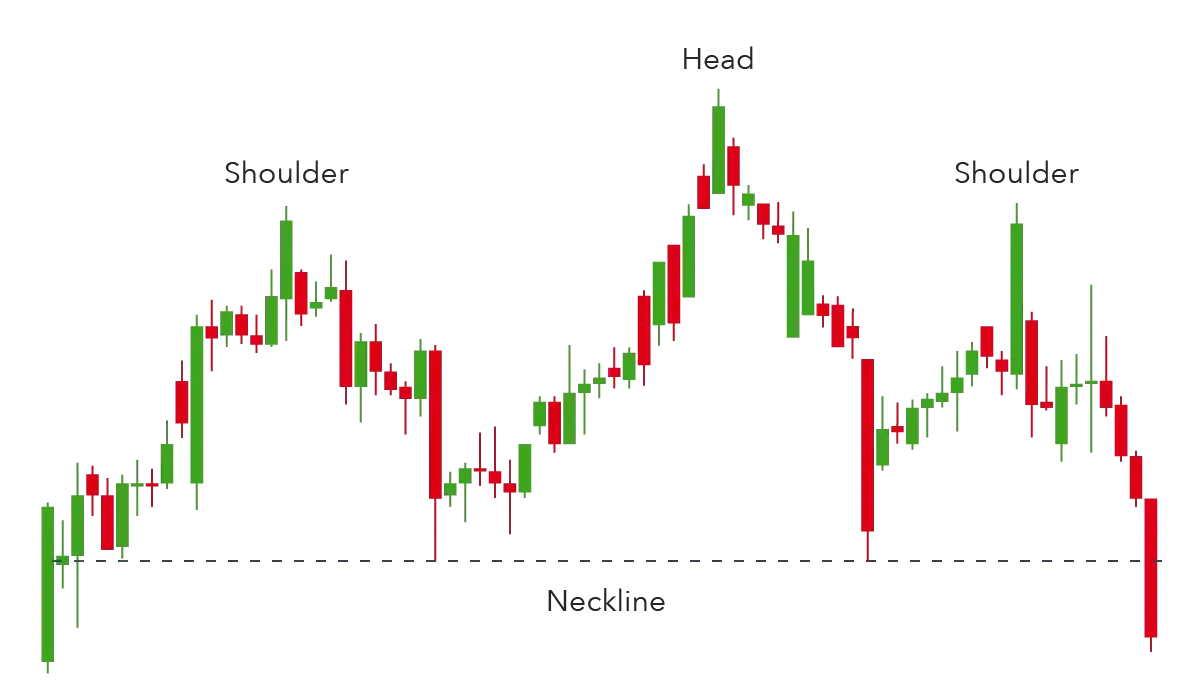
How to Identify a Head and Shoulders Pattern:
- Three Peaks: There should be three distinct peaks. The middle peak (the "head") should be slightly higher than the other two peaks (the "shoulders").
- Neckline: All three peaks should fall back to a common support level, known as the "neckline."
- Breakout: Once the price breaks below the neckline, it suggests a potential bearish reversal.
Head and Shoulders: Key Points
- The first and third peaks are usually smaller than the second peak.
- The neckline is the critical level to watch. If the price breaks below the neckline, it's a strong signal of a potential downtrend.
- The size of the head and shoulders pattern can indicate the potential magnitude of the subsequent price movement.
Double Top
The double top pattern is a chart pattern that can signal a potential reversal from an uptrend to a downtrend. It's named after its shape, which resembles two peaks at roughly the same price level.
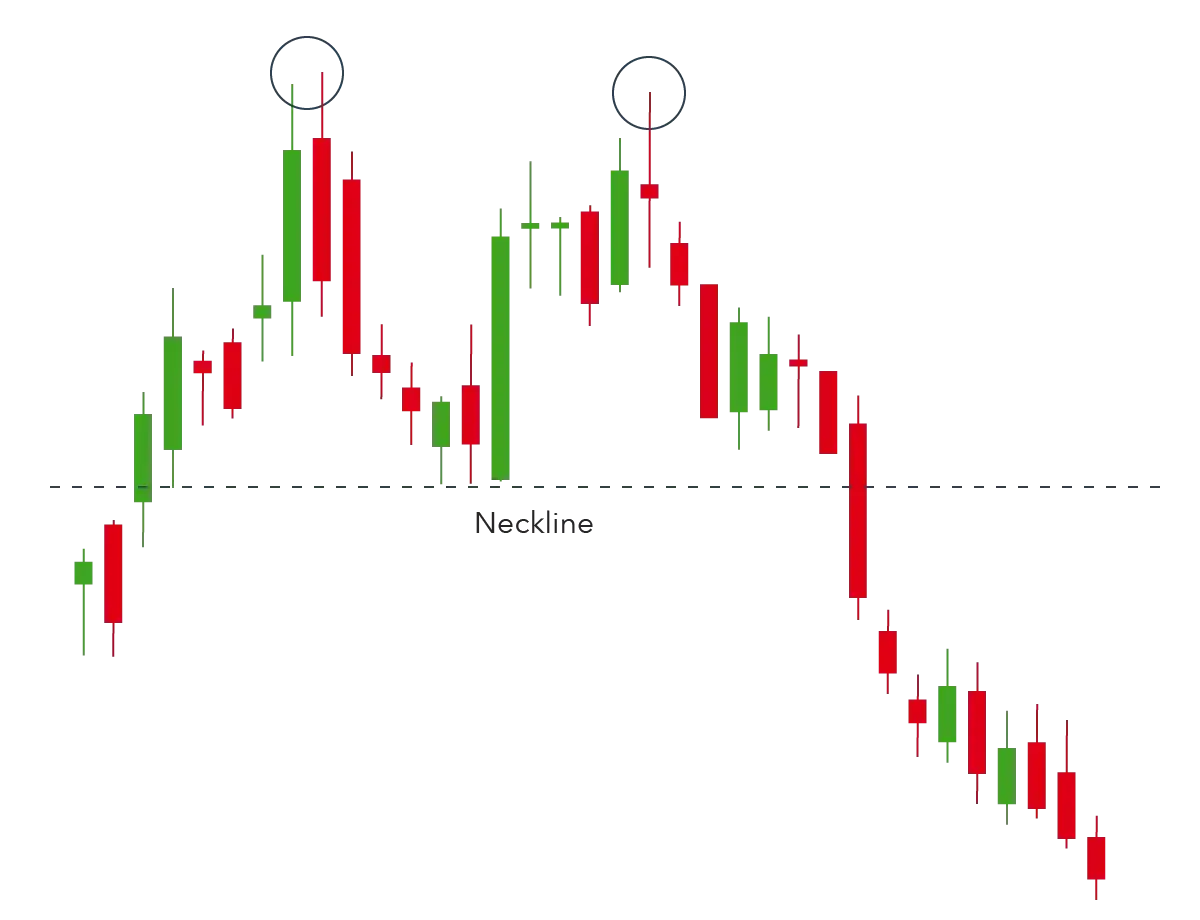
How to Identify a Double Top Pattern:
- Two Peaks: There should be two distinct peaks at approximately the same price level.
- Retracement: After the first peak, the price should retrace back to a level of support.
- Second Peak: The price should then climb back up to form a second peak, roughly at the same level as the first.
- Breakout: If the price breaks below the neckline (the level of support between the two peaks), it suggests a potential bearish reversal.
Double Top: Key Points
- The two peaks should be at approximately the same price level.
- The retracement to the neckline is important for confirming the pattern.
- If the price breaks below the neckline, it's a strong signal of a potential downtrend.
Double Bottom
The double bottom pattern is a chart pattern that can signal a reversal from a downtrend to an uptrend. It's named after its shape, which resembles two troughs at approximately the same price level.
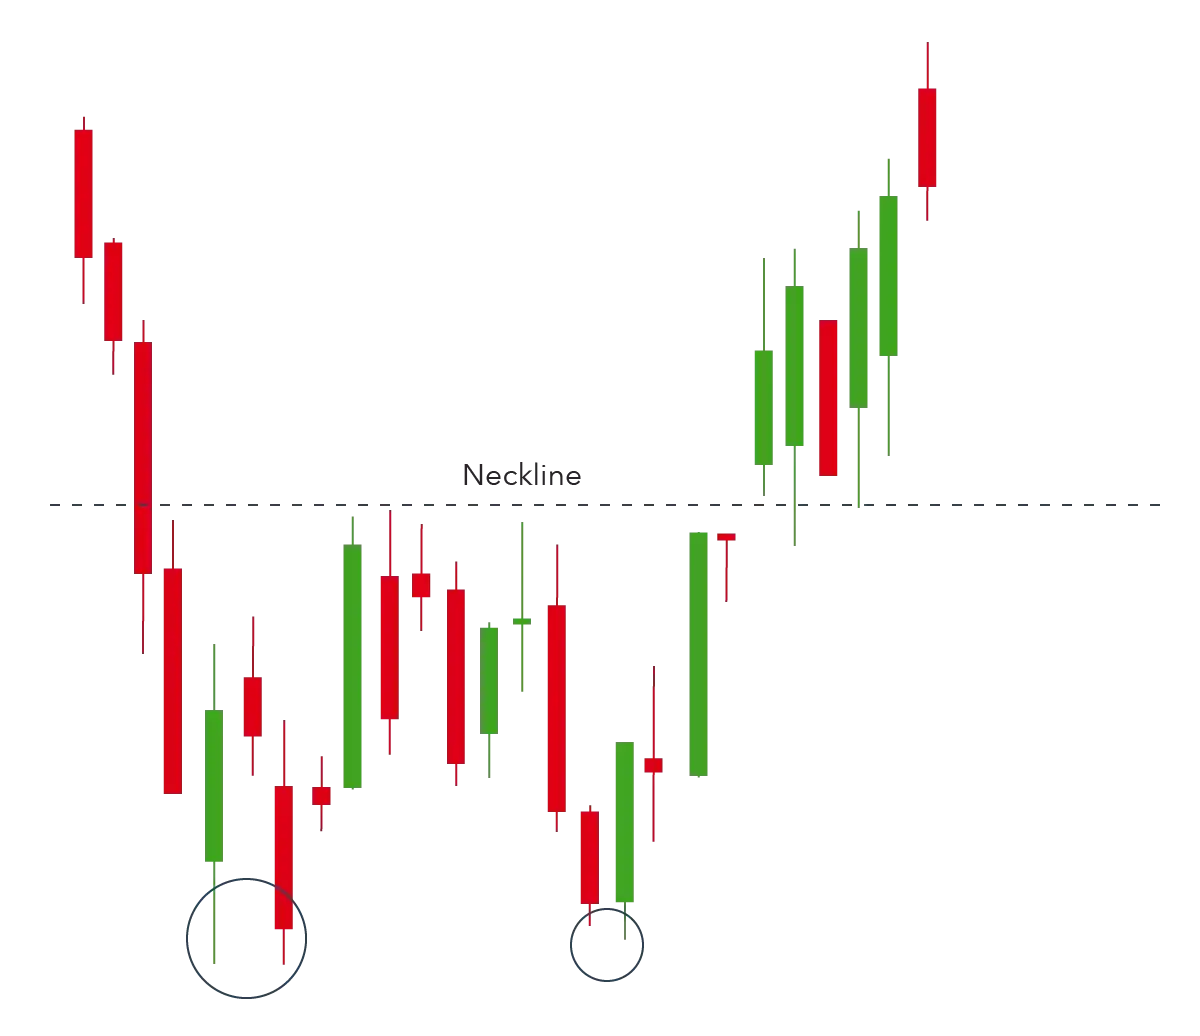
How to Identify a Double Bottom Pattern:
- Two Troughs: There should be two distinct troughs at approximately the same price level.
- Retracement: After the first trough, the price should rise to a level of resistance.
- Second Trough: The price should then fall back down to form a second trough, roughly at the same level as the first.
- Breakout: If the price breaks above the resistance level between the two troughs, it suggests a potential bullish reversal.
Double Bottom: Key Points
- The two troughs should be at approximately the same price level.
- The retracement to the resistance level is important for confirming the pattern.
- If the price breaks above the resistance level, it's a strong signal of a potential uptrend.
Rounding Bottom
The rounding bottom pattern is a chart pattern that can indicate either a continuation of a trend or a reversal. It's named after its shape, which resembles a rounded bottom.
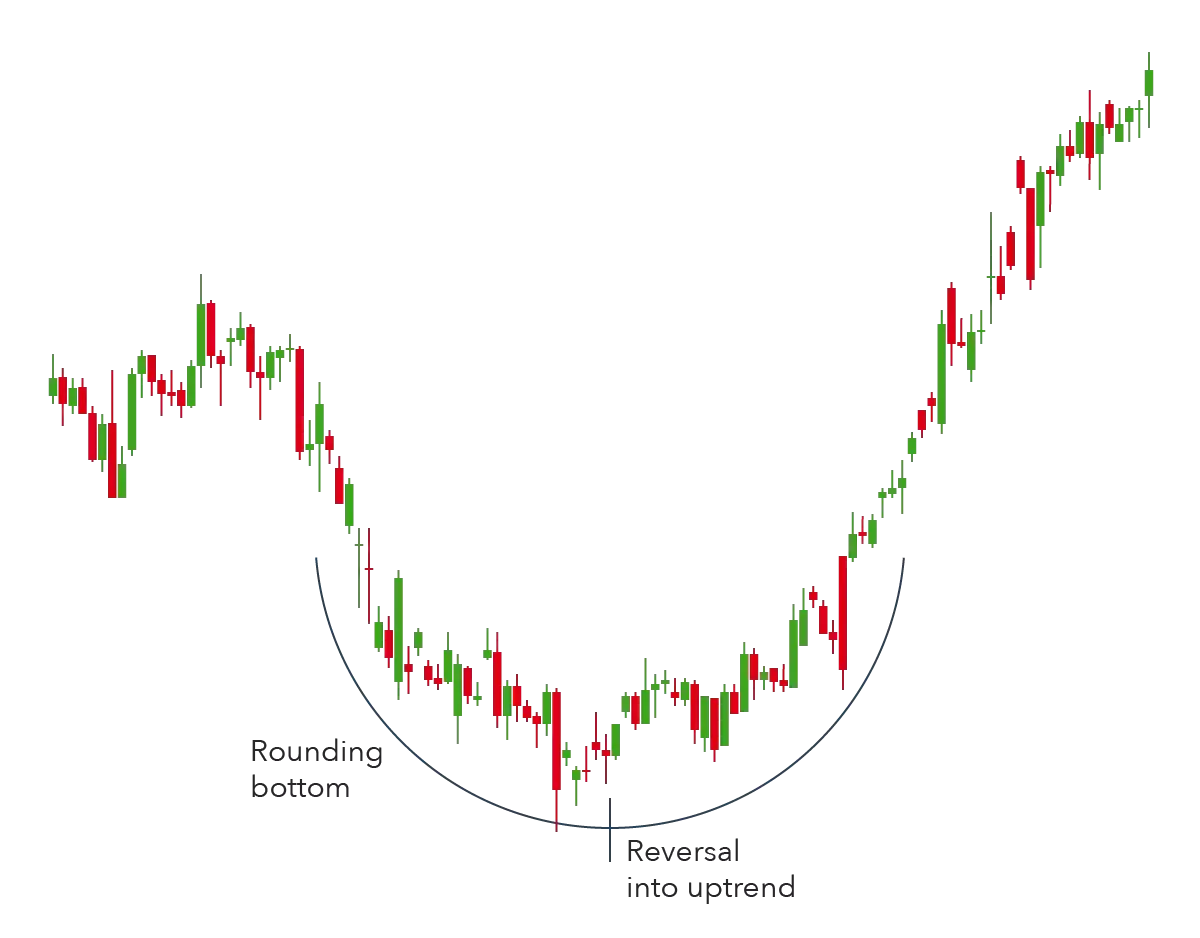
How to Identify a Rounding Bottom Pattern:
- Downward Trend: The pattern typically forms during a downtrend.
- Rounding Bottom: The price forms a rounded bottom shape, gradually decreasing and then increasing.
- Breakout: If the price breaks above the resistance level of the rounding bottom, it suggests a potential bullish reversal.
Rounding Bottom: Key Points
- The rounding bottom pattern can indicate either a continuation or a reversal, depending on the context.
- If the rounding bottom forms during an uptrend, it may signal a temporary pause before the uptrend continues.
- If the rounding bottom forms during a downtrend, it may signal a reversal to an uptrend.
Cup and Handle
The cup and handle pattern is a bullish continuation pattern that indicates a potential continuation of an uptrend after a temporary pause. It's named after its shape, which resembles a cup followed by a handle.
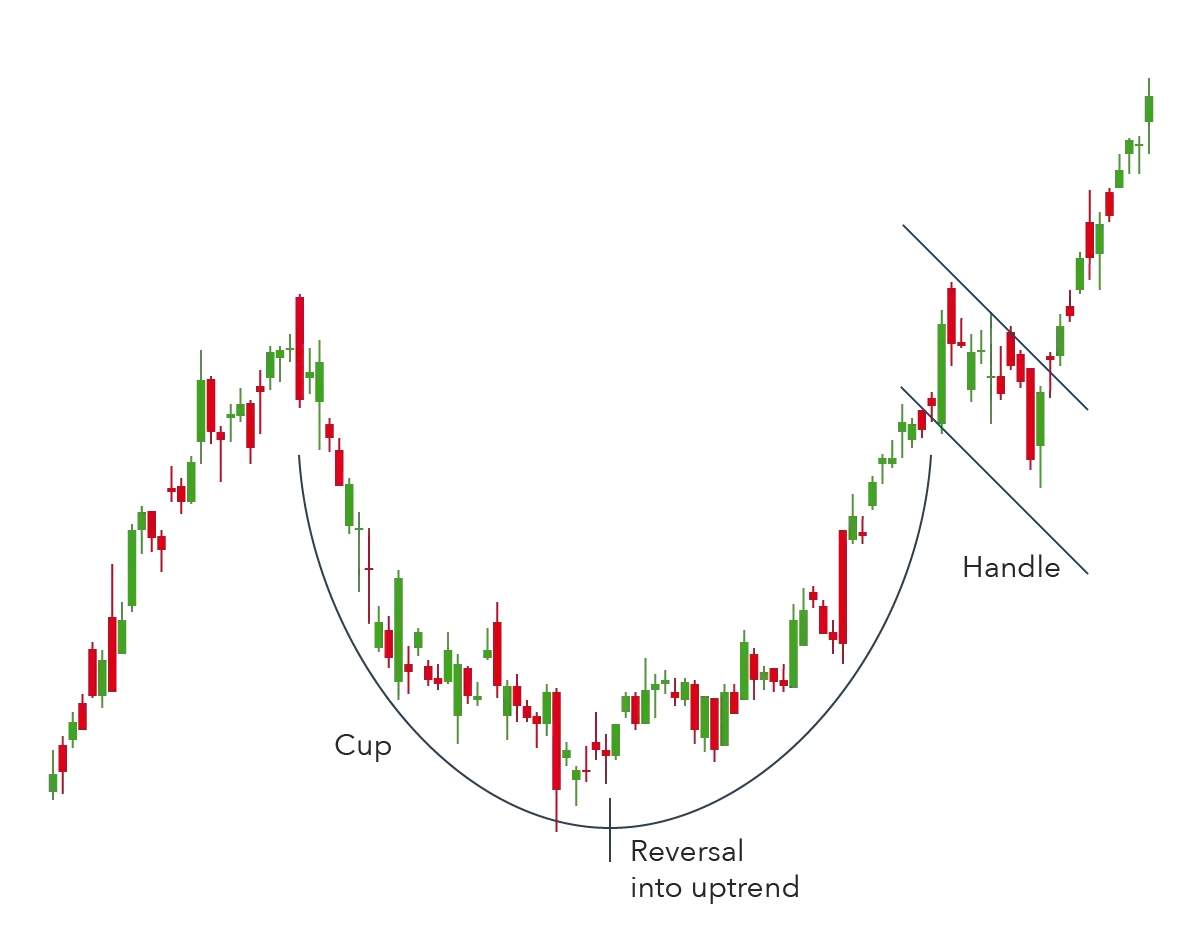
How to Identify a Cup and Handle Pattern:
- Cup Formation: The price forms a rounded bottom shape, similar to a rounding bottom pattern. This represents a period of consolidation or a temporary pause in the uptrend.
- Handle Formation: After the cup, the price forms a handle, which is a short-term downtrend or retracement. The handle is typically confined between two parallel lines on the price chart.
- Breakout: If the price breaks above the resistance level of the handle, it suggests a continuation of the overall bullish trend.
Cup and Handle: Key Points
- The cup and handle pattern is a bullish continuation pattern, not a reversal pattern.
- The handle represents a temporary pause or retracement before the uptrend resumes.
- The breakout above the handle is a strong signal of a continuation of the uptrend.
Wedges
Wedges are chart patterns that indicate a narrowing of price movement between two converging trend lines. There are two types of wedges: rising and falling.
Rising Wedge
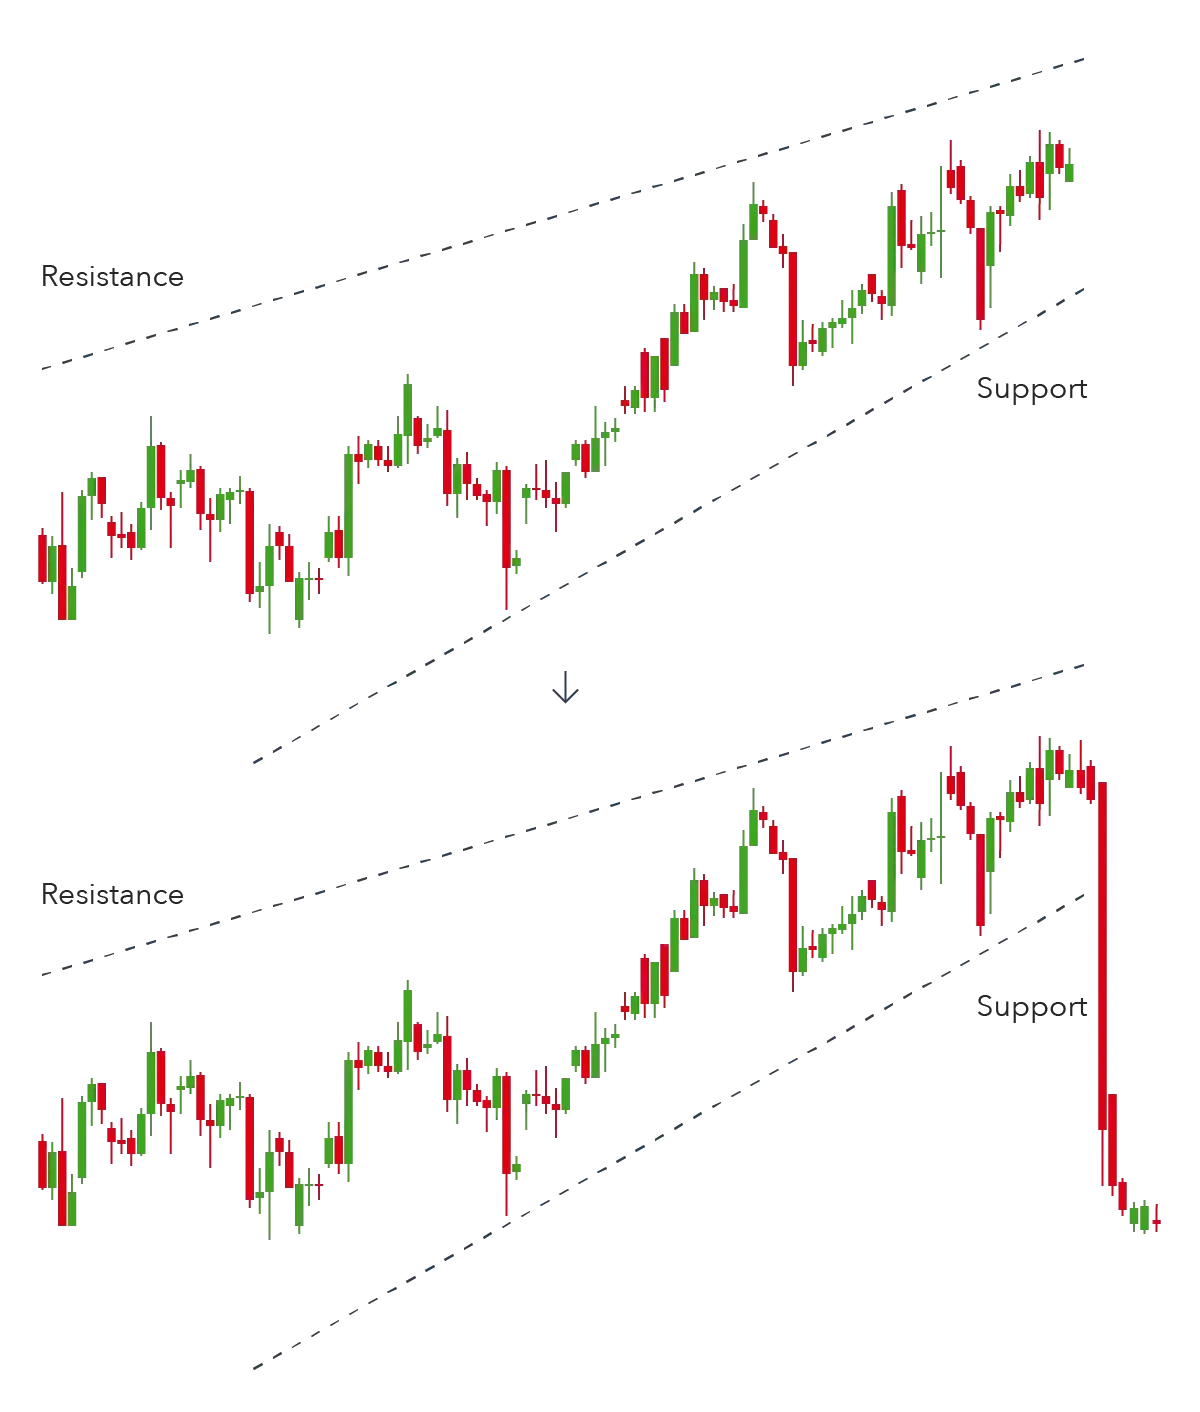
- Formation: A rising wedge forms when the price is caught between two upwardly sloping trend lines. The support line is steeper than the resistance line.
- Signal: A rising wedge typically signals a bearish reversal. The price is likely to break through the support line and enter a downtrend.
Falling Wedge
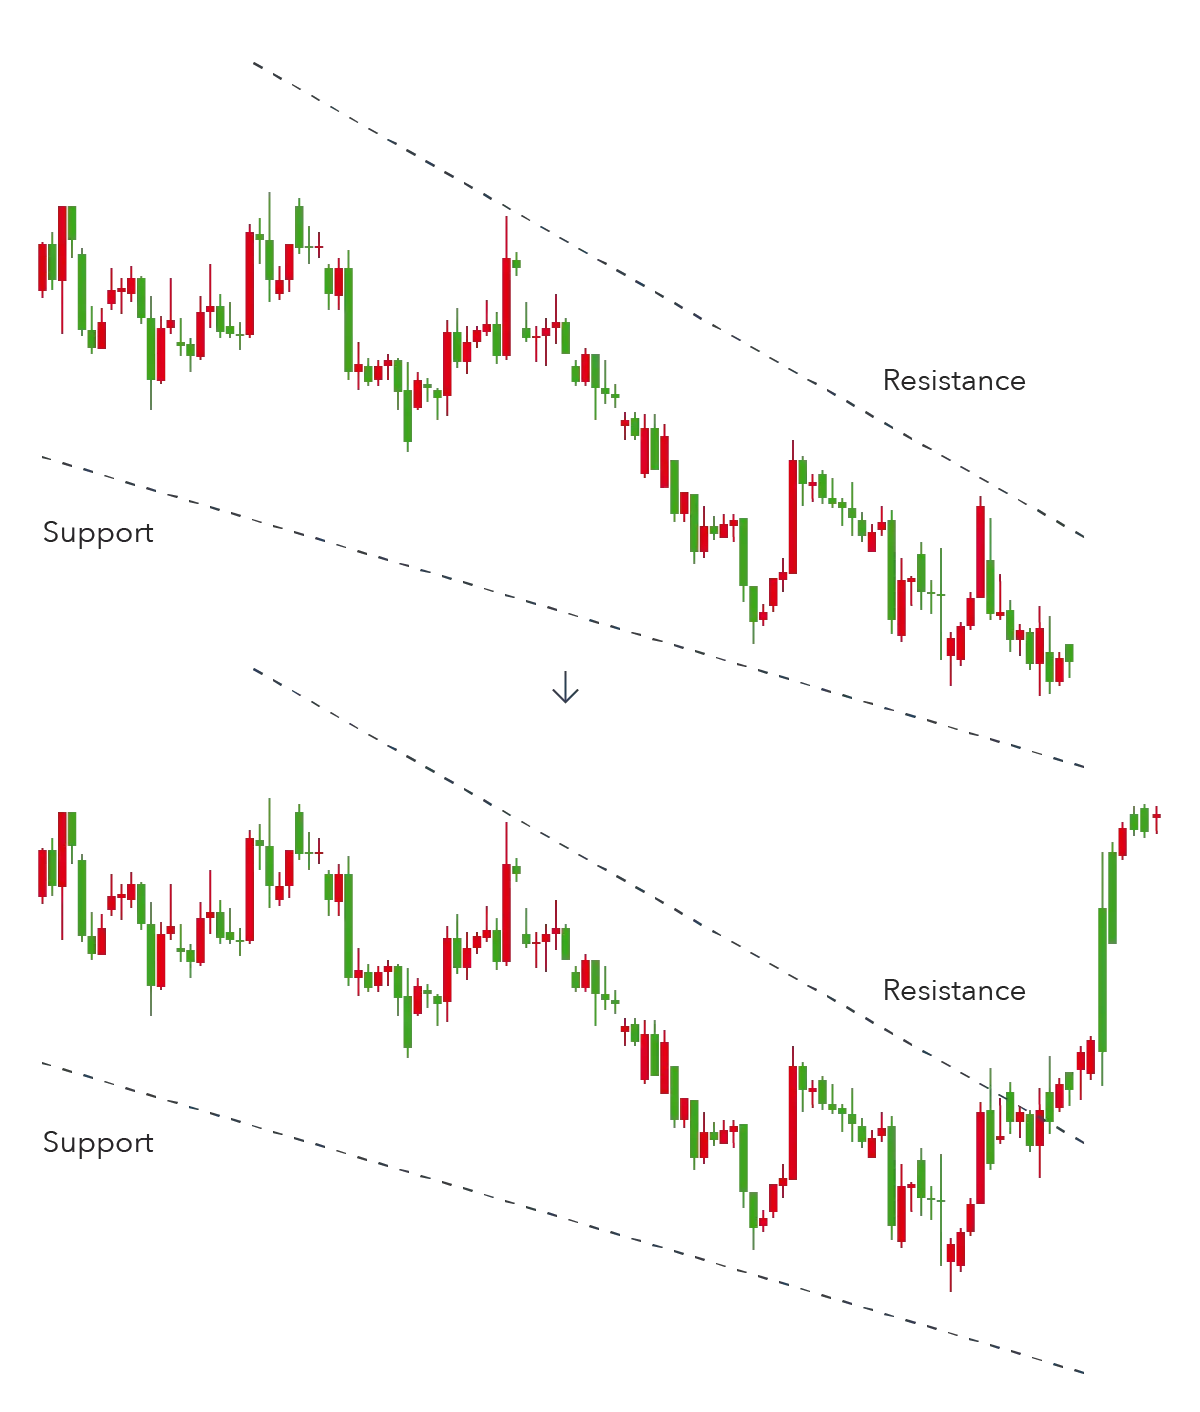
- Formation: A falling wedge forms when the price is caught between two downwardly sloping trend lines. The resistance line is steeper than the support line.
- Signal: A falling wedge typically signals a bullish reversal. The price is likely to break through the resistance line and enter an uptrend.
Wedges: Key Points
- Wedges are reversal patterns, meaning they can indicate a change in trend direction.
- Rising wedges are generally bearish, while falling wedges are generally bullish.
- The breakout of the wedge can be a strong signal of the impending trend reversal.
Pennants
Pennants are chart patterns that form after a period of strong price movement, followed by a period of consolidation. They can be either bullish or bearish and can indicate a continuation or reversal of the trend.
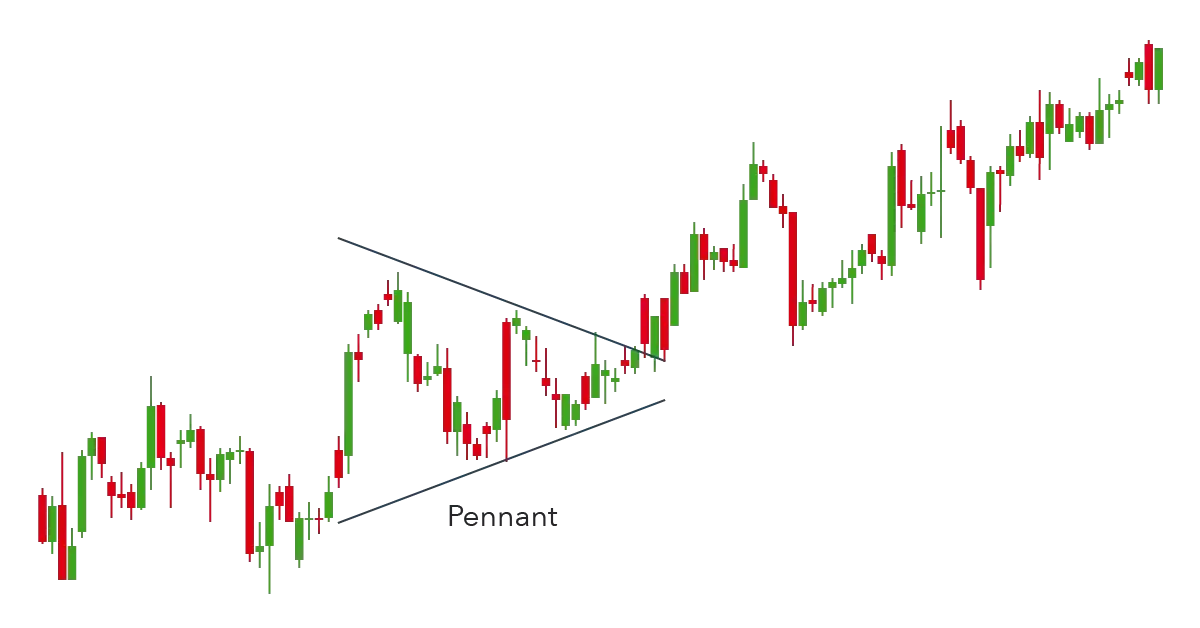
Bullish Pennant
- Formation: A bullish pennant forms after an uptrend. The price enters a period of consolidation, creating a triangular shape.
- Signal: A bullish pennant typically indicates a continuation of the uptrend. The price is likely to break out above the resistance line of the pennant.
Bearish Pennant
- Formation: A bearish pennant forms after a downtrend. The price enters a period of consolidation, creating a triangular shape.
- Signal: A bearish pennant typically indicates a continuation of the downtrend. The price is likely to break below the support line of the pennant.
Pennats: Key Points
- Pennants are similar to wedges but are generally wider.
- Wedges always have sloping trend lines, while pennants can be horizontal or have slightly sloping trend lines.
- Pennants can indicate either a continuation or a reversal of the trend, depending on the context.
Ascending Triangle
The ascending triangle is a bullish continuation pattern that indicates a potential continuation of an uptrend. It's named after its shape, which resembles a triangle with a horizontal top and an ascending bottom.
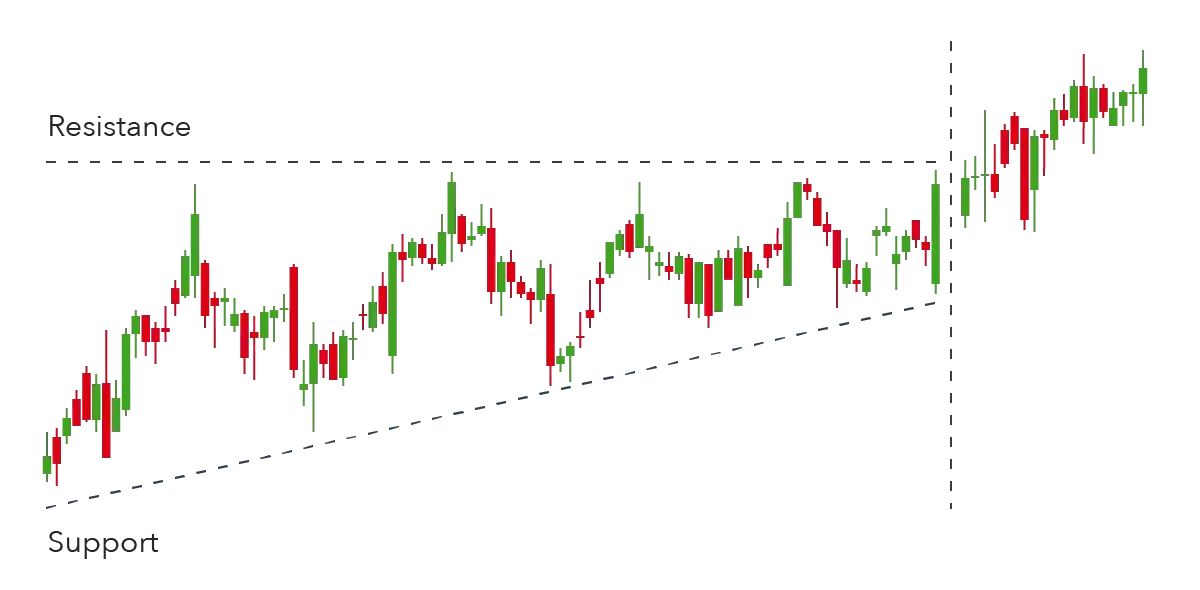
How to Identify an Ascending Triangle:**
- Upward Trend: The ascending triangle typically forms during an uptrend.
- Horizontal Resistance: A horizontal line is drawn along the swing highs (the highest prices reached during each period).
- Ascending Support: An ascending trend line is drawn along the swing lows (the lowest prices reached during each period).
- Convergence: The horizontal resistance line and the ascending support line converge, creating the triangular shape.
Ascending Triangle: Key Points
- The ascending triangle is a bullish continuation pattern, meaning it suggests a continuation of the uptrend.
- The horizontal resistance line indicates a level of resistance that the price has struggled to break through.
- The ascending support line indicates that there is increasing buying pressure, pushing the price higher.
- A breakout above the horizontal resistance line is a strong signal of a continuation of the uptrend.
Descending Triangle
The descending triangle is a bearish continuation pattern that indicates a potential continuation of a downtrend. It's named after its shape, which resembles a triangle with a horizontal bottom and a descending top.
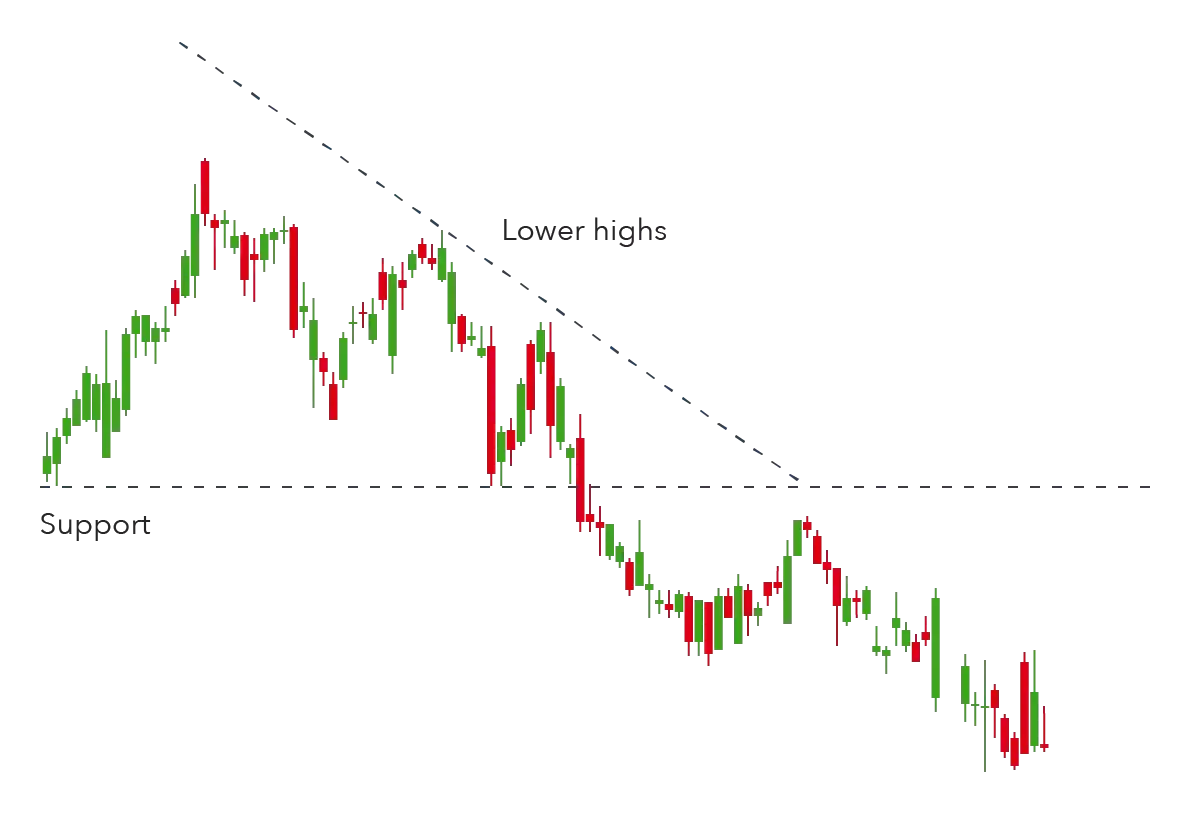
How to Identify a Descending Triangle:
- Downtrend: The descending triangle typically forms during a downtrend.
- Horizontal Support: A horizontal line is drawn along the swing lows (the lowest prices reached during each period).
- Descending Resistance: A descending trend line is drawn along the swing highs (the highest prices reached during each period).
- Breakout: The price is likely to break through the support line and enter a further downtrend.
Descending Triangle: Key Points
- The descending triangle is a bearish continuation pattern, meaning it suggests a continuation of the downtrend.
- The horizontal support line indicates a level of support that the price has struggled to break above.
- The descending resistance line indicates that there is increasing selling pressure, pushing the price lower.
- A breakout below the support line is a strong signal of a continuation of the downtrend.
Symmetrical Triangle: A Technical Analysis Pattern
The symmetrical triangle is a chart pattern that can indicate either a continuation or a reversal of the trend, depending on the market context. It's named after its shape, which resembles a triangle with converging sides.
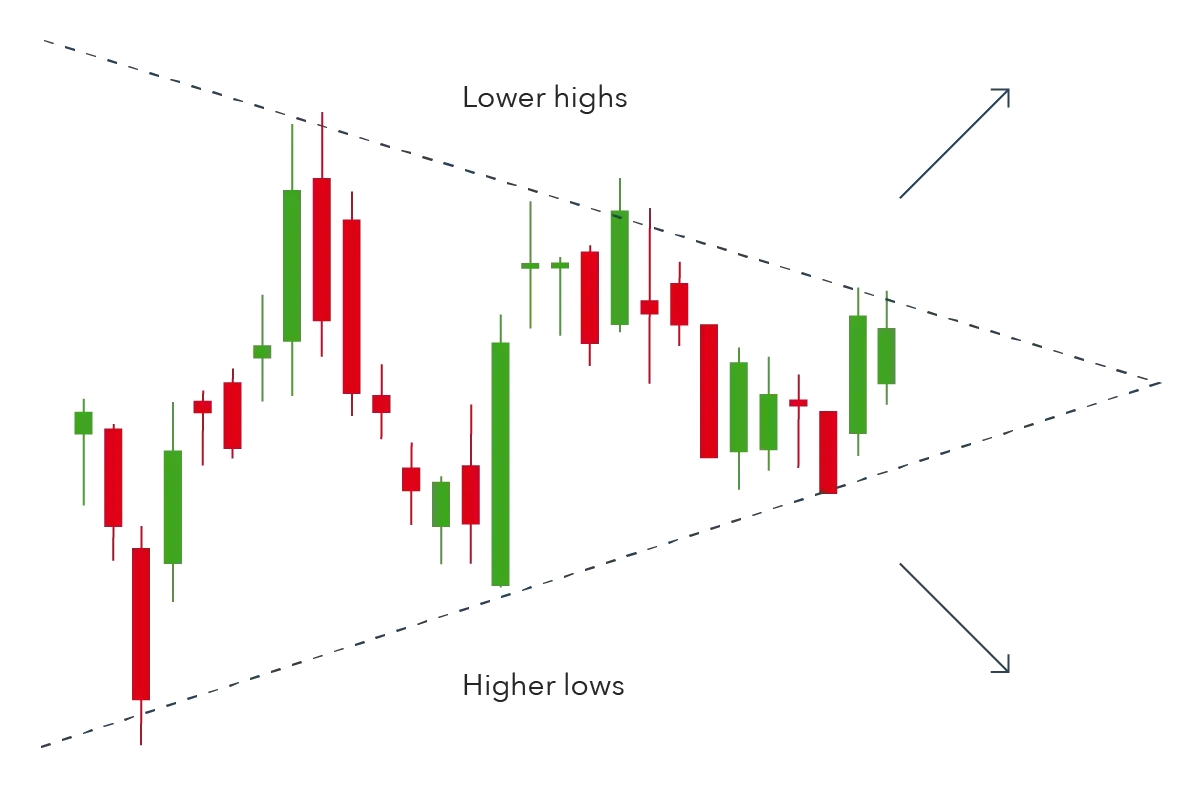
How to Identify a Symmetrical Triangle:
- Converging Trend Lines: A symmetrical triangle forms when the price is caught between two converging trend lines, one ascending and one descending.
- Tightening Price Action: As the trend lines converge, the price movement becomes narrower, indicating a period of indecision.
- Breakout: When the price breaks out of the triangle, it can signal a continuation or reversal of the trend.
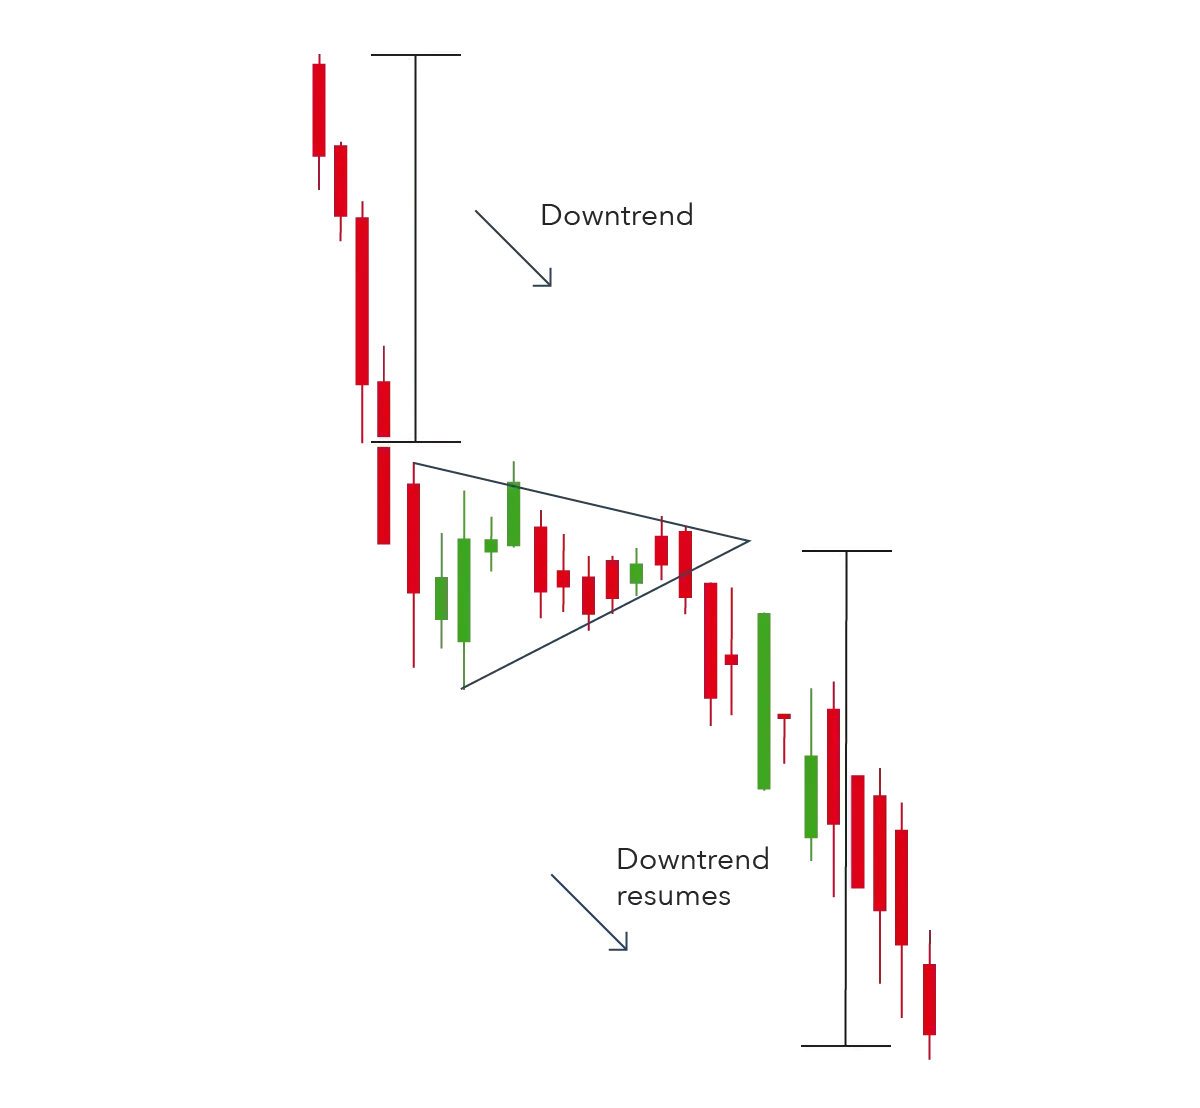
Symmetrical Triangle: Key Points
- Symmetrical triangles can be bullish or bearish, depending on the direction of the breakout.
- If the triangle forms during an uptrend, a breakout above the resistance line indicates a continuation of the uptrend.
- If the triangle forms during a downtrend, a breakout below the support line indicates a continuation of the downtrend.
- If there's no clear trend before the triangle forms, the breakout could be in either direction, making the triangle a bilateral pattern.
Conclusion
Chart patterns are valuable tools for technical analysis, providing visual insights into price movements and potential trends. By understanding various patterns, such as head and shoulders, double tops, double bottoms, triangles, and pennants, you can gain valuable information about market sentiment, support and resistance levels, and potential trend reversals.
Note
- Chart patterns can help you identify potential support and resistance levels.
- Chart patterns can signal potential trend reversals or continuations.
- Chart patterns should be used in conjunction with other technical and fundamental analysis tools.