Candlesticks
Candlesticks are a popular tool used in technical analysis to visualize price movements over a specific period.
Candlesticks
Candlesticks are a visual representation of price movements over a specific time period. They provide a wealth of information about a security's price action, making them a popular tool among traders and investors.
Components of a Candlestick
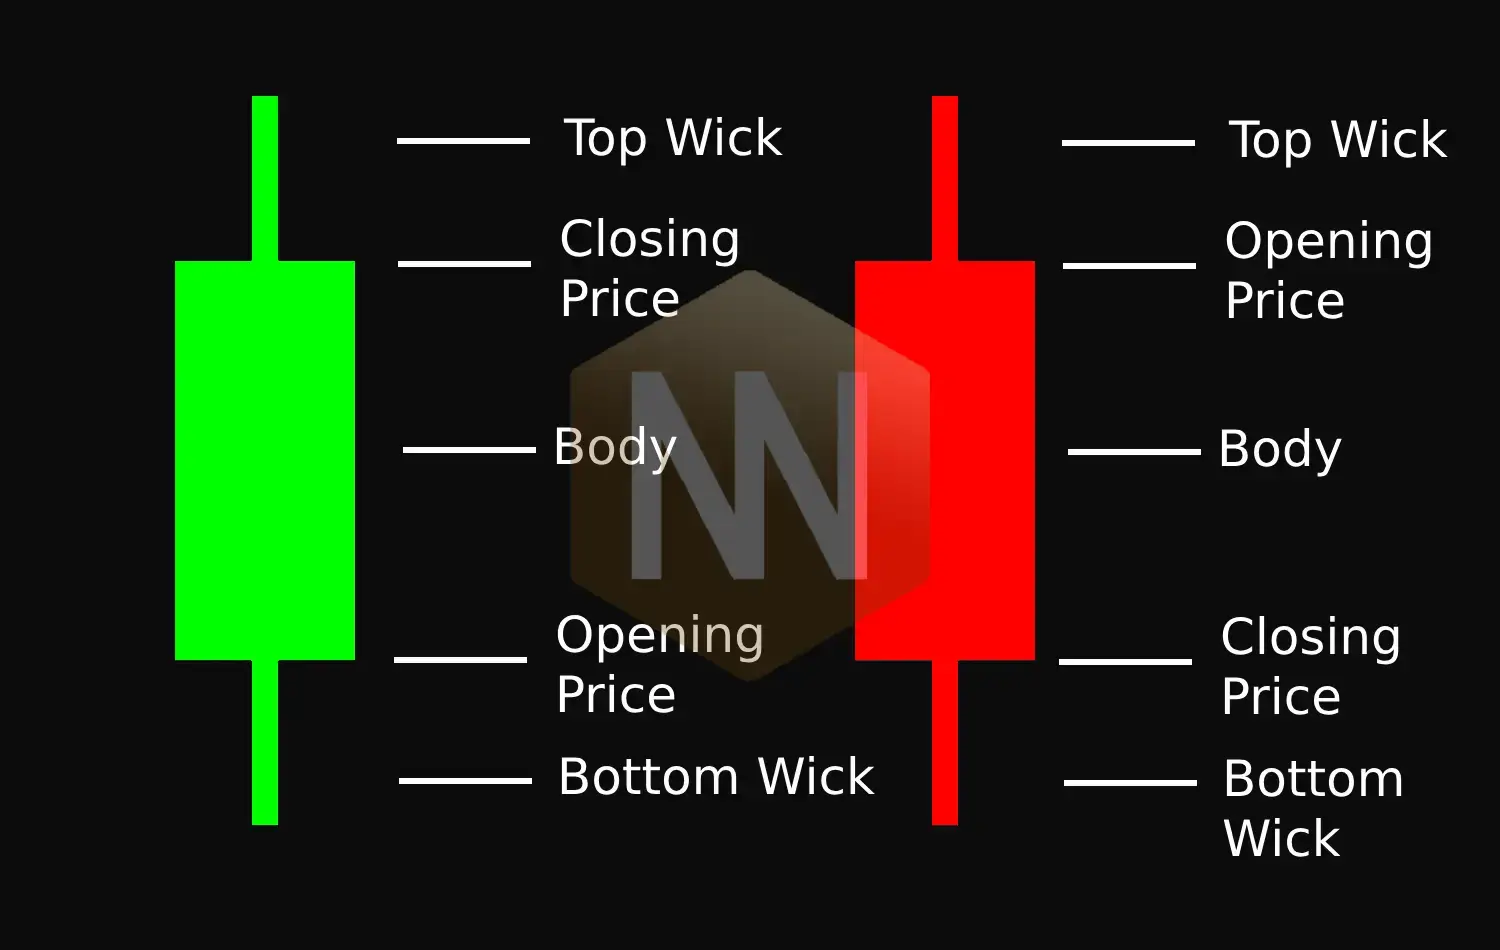
A candlestick is made up of three main components:
- The Body: This represents the open-to-close price range.
- If the closing price is higher than the opening price, the body is filled (usually green or white), indicating an uptrend.
- If the closing price is lower than the opening price, the body is hollow (usually red or black), indicating a downtrend.
- The Wick or Shadow: This indicates the intra-day high and low prices.
- The upper wick represents the highest price reached during the period.
- The lower wick represents the lowest price reached during the period.
- The Color: The color of the candlestick reveals the direction of market movement.
- A green (or white) body indicates a price increase (uptrend).
- A red (or black) body indicates a price decrease (downtrend).
By studying candlestick patterns, traders can identify potential trends, reversals, and trading opportunities.
Six Bullish Candlestick Patterns
These patterns are visual signals that suggest a potential reversal from a downtrend and a possible upward price movement. They can be helpful indicators for traders considering buying stocks (going long).
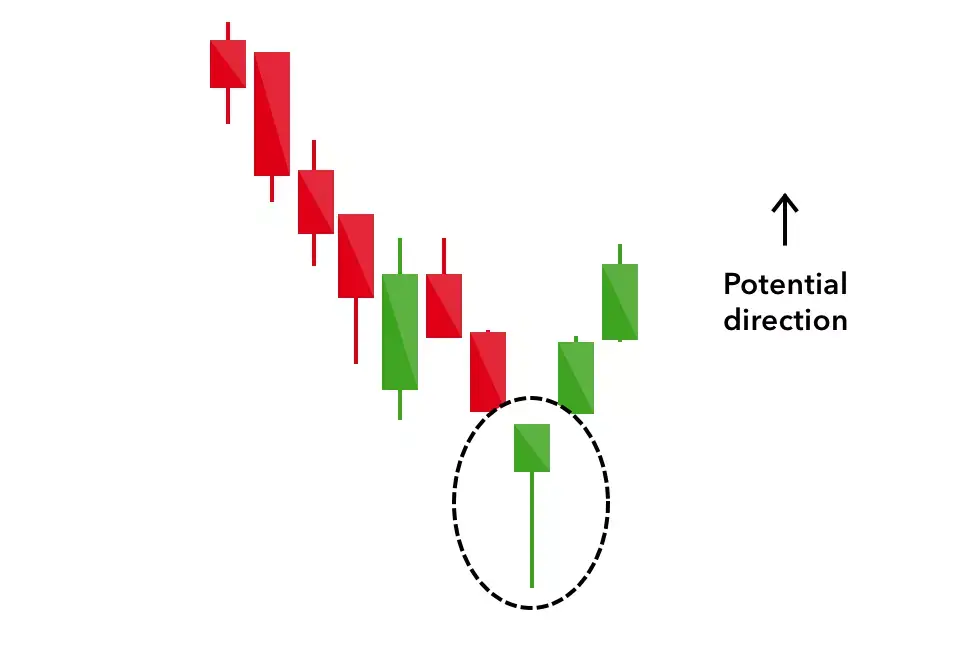
Hammer
A short body with a long lower wick, indicating strong buying pressure overcame selling pressure.
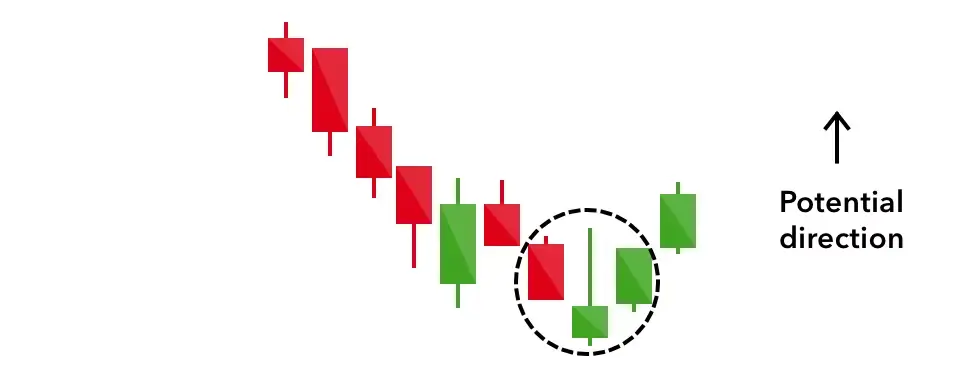
Inverse Hammer
Similar to a hammer, but with a long upper wick, suggesting buyers are gaining control.
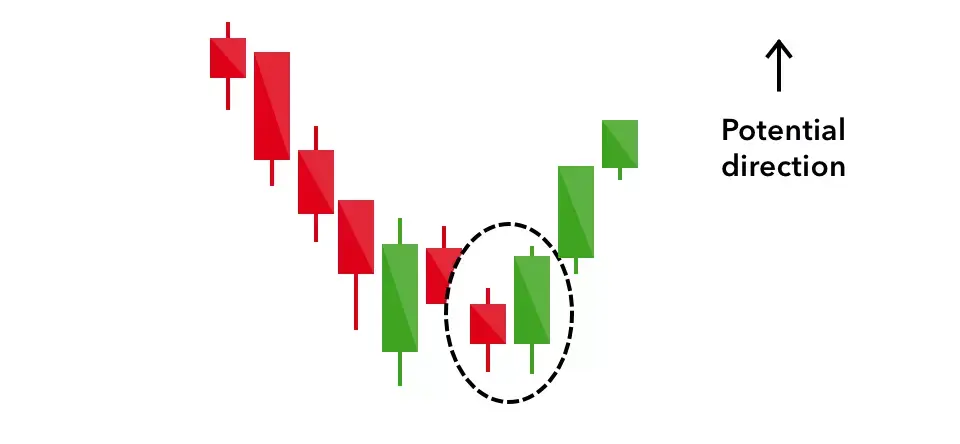
Bullish Engulfing
A larger green candle completely covers a smaller red one, indicating a strong bullish reversal.
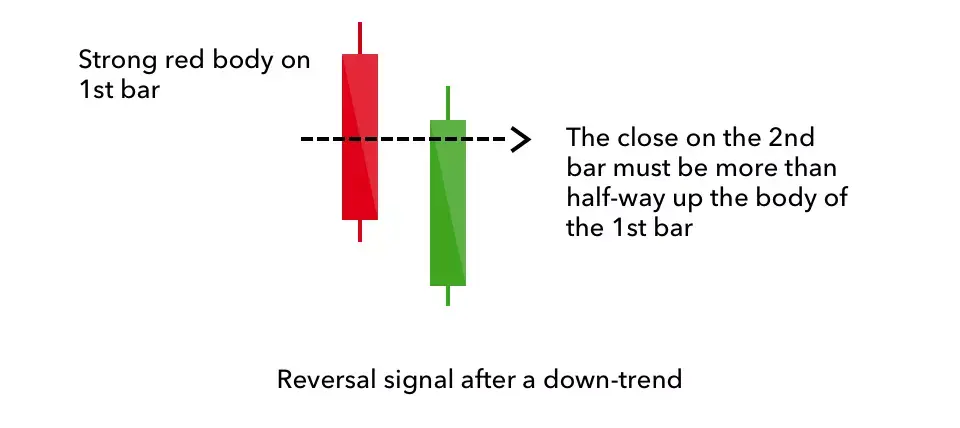
Piercing Line
A long red candle followed by a long green one, with a significant gap up, showing strong buying pressure.
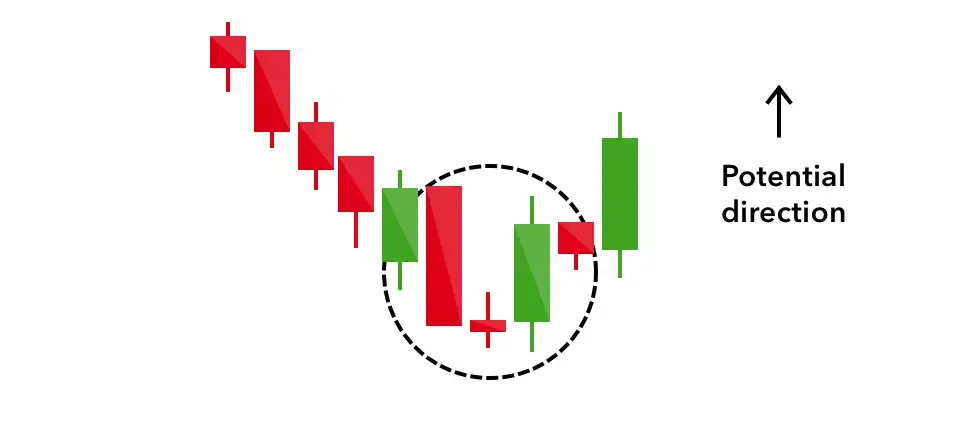
Morning Star
A three-day pattern with a red candle, a small neutral candle, and a long green candle, indicating a potential end to a downtrend.
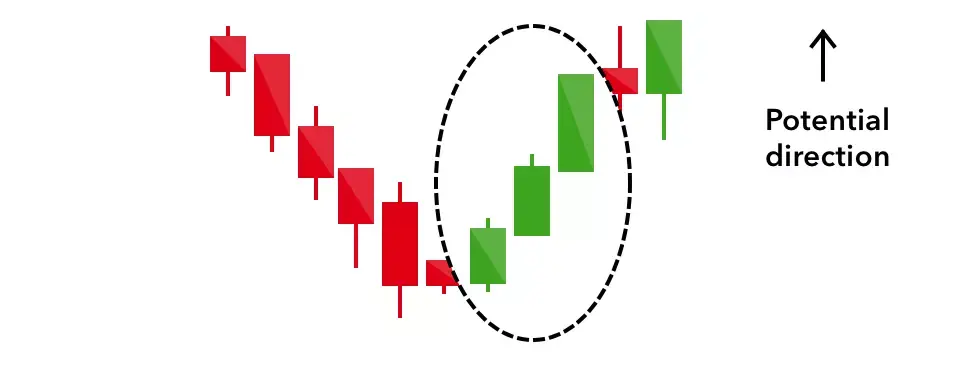
Three White Soldiers
Three consecutive long green candles with small wicks, showing a strong upward trend and sustained buying pressure. Remember, these are just patterns and should be used in conjunction with other technical and fundamental analysis tools.
Six Bearish Candlestick Patterns
These patterns often appear at the end of uptrends and suggest a potential reversal to a downtrend. They can signal that selling pressure is increasing and that it might be time for traders to close their long positions and wait for a better entry point.
Hanging Man
A small body with a long lower wick, indicating strong selling pressure.
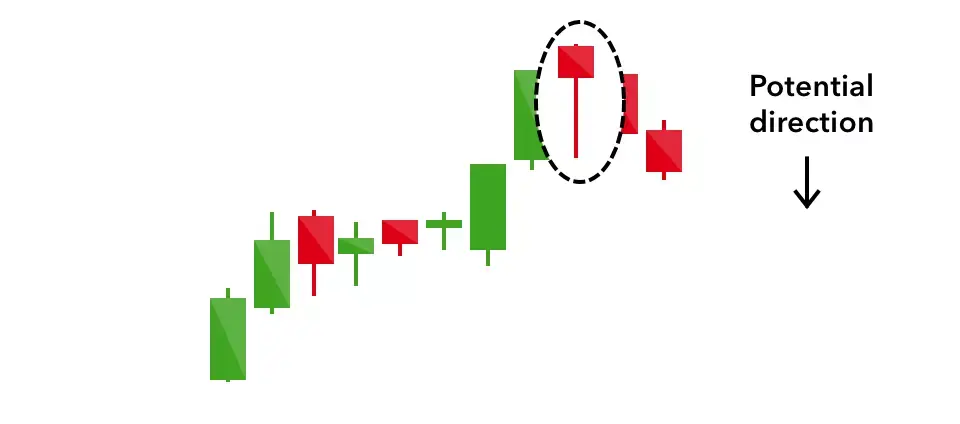
Shooting Star
Similar to a hanging man but with a long upper wick, suggesting a failed attempt to continue the uptrend.
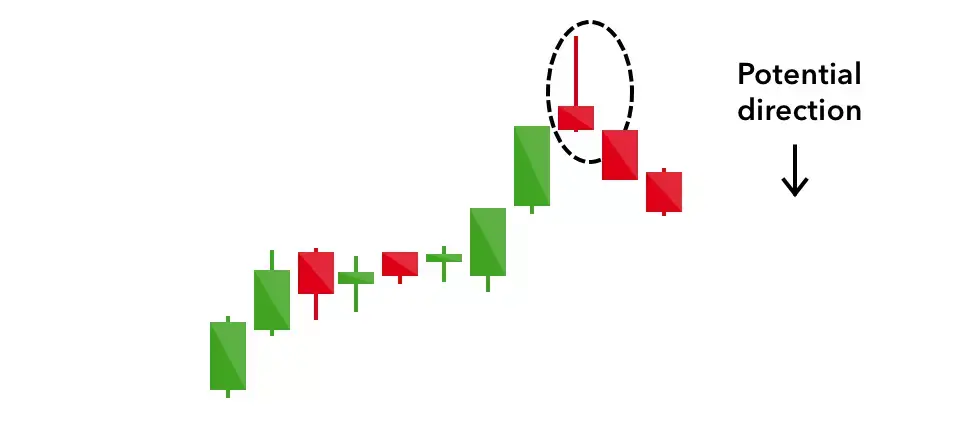
Bearish Engulfing
A larger red candle completely covers a smaller green one, indicating a reversal and potential downtrend.
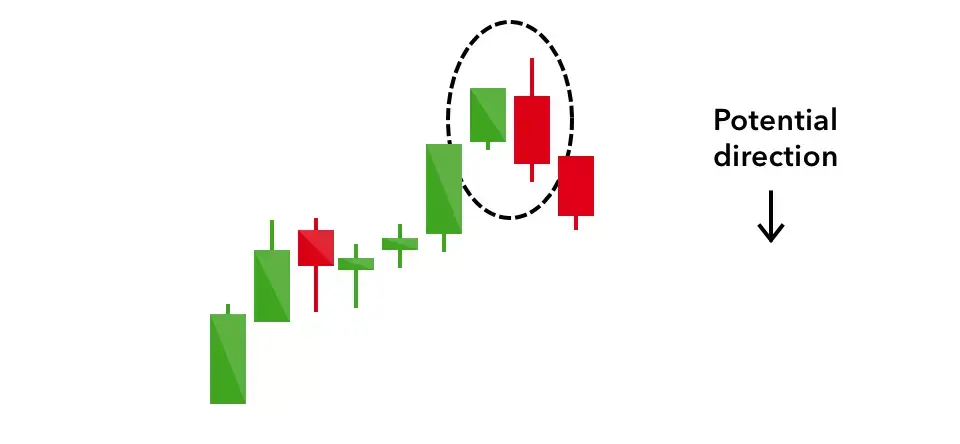
Evening Star
A three-day pattern with a green candle, a small neutral candle, and a large red candle, signaling a reversal from an uptrend.
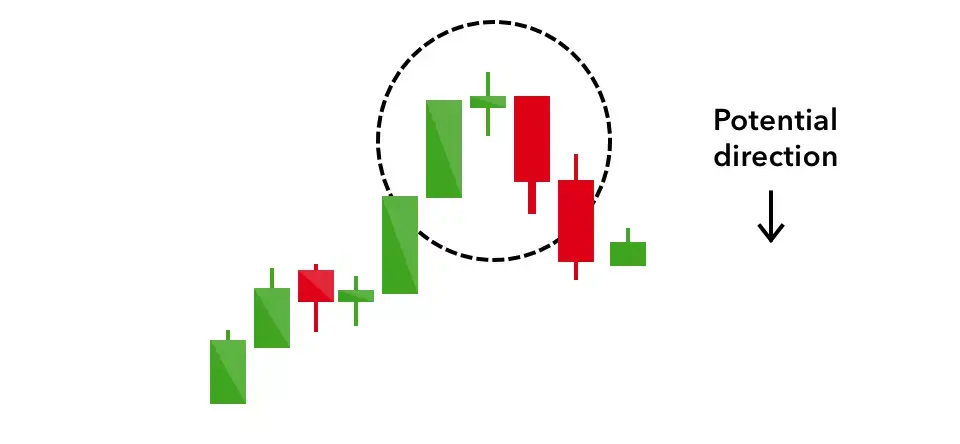
Three Black Crows
Three consecutive long red candles with short wicks, indicating a strong downtrend and increasing selling pressure.
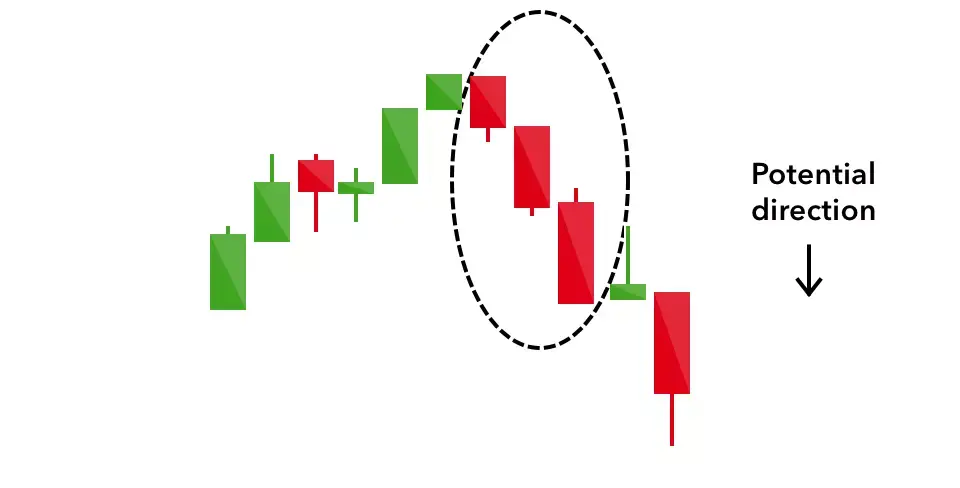
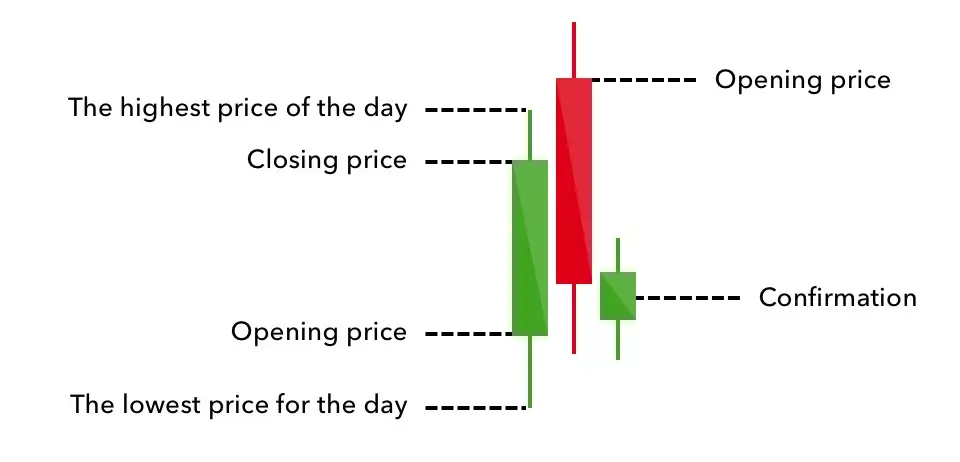
Dark Cloud Cover
A red candle that opens above the previous green candle and closes below its midpoint, signaling a bearish reversal.
Four Continuation Candlestick Patterns
These patterns don't indicate a change in market direction but rather a period of market indecision or neutral price movement. They can help traders identify potential pauses or consolidations within existing trends.
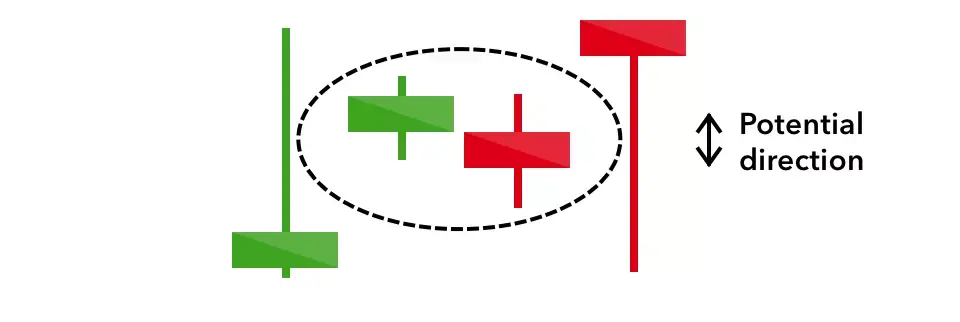
Doji
A cross-shaped candlestick with a short body and equal-length wicks, signaling a balance between buyers and sellers.
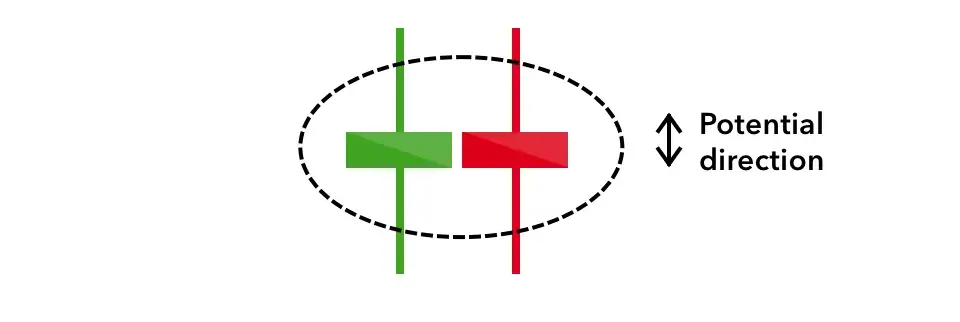
Spinning Top
A short body with equal-length wicks, indicating market indecision and a potential pause in the current trend.
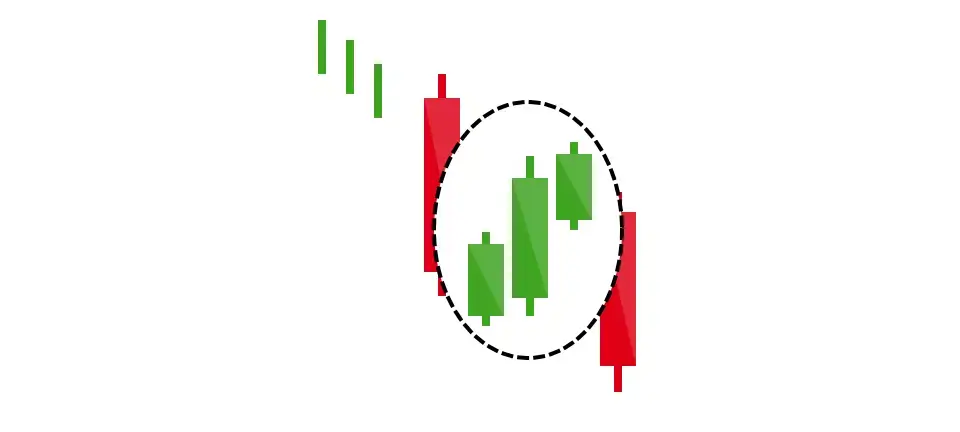
Falling Three Methods
A bearish pattern with three small green candles contained within two red candles, suggesting that sellers are maintaining control.
Rising Three Methods
A bullish pattern with three small red candles contained within two green candles, indicating that buyers are still in control despite some selling pressure.

Conclusion
Candlesticks are a valuable tool for technical analysis, providing visual insights into price movements and potential trends. By understanding the components of a candlestick and recognizing common patterns, you can enhance your ability to identify potential buying and selling opportunities.
Key Takeaways:
- Bullish patterns often signal a potential reversal from a downtrend and suggest a possible upward price movement.
- Bearish patterns typically indicate a reversal from an uptrend and suggest a potential downward price movement.
- Continuation patterns suggest a pause or consolidation in the current trend, rather than a change in direction.
Note
Candlestick patterns are just one tool for technical analysis. It's essential to combine them with other forms of analysis, such as fundamental analysis and volume analysis, to make informed trading decisions.