Technical Indicators
Technical indicators are based on the assumption that past price movements can provide clues about future price movements
What are Technical Indicators?
Technical indicators are mathematical calculations that analyze past price data to identify potential trends, patterns, and signals. They can be used to help traders make informed decisions about buying and selling securities.
Technical indicators can be categorized into several groups, including:
- Trend indicators: These indicators help identify the direction of a trend, such as uptrends, downtrends, or sideways trends. Examples include moving averages, MACD, and RSI.
- Momentum indicators: These indicators measure the speed and strength of price movements. Examples include RSI, stochastics, and rate of change.
- Volatility indicators: These indicators measure the volatility or price fluctuations of a security. Examples include Bollinger Bands and average true range.
Note
By using technical indicators, traders can gain valuable insights into market conditions and potential trading opportunities. However, it's important to remember that technical indicators are not foolproof and should be used in conjunction with other forms of analysis.
Moving Average (MA)
Moving averages are a popular technical indicator used to smooth out price fluctuations and identify trends. There are two main types: Simple Moving Average (SMA) and Exponential Moving Average (EMA).
Simple Moving Average (SMA)
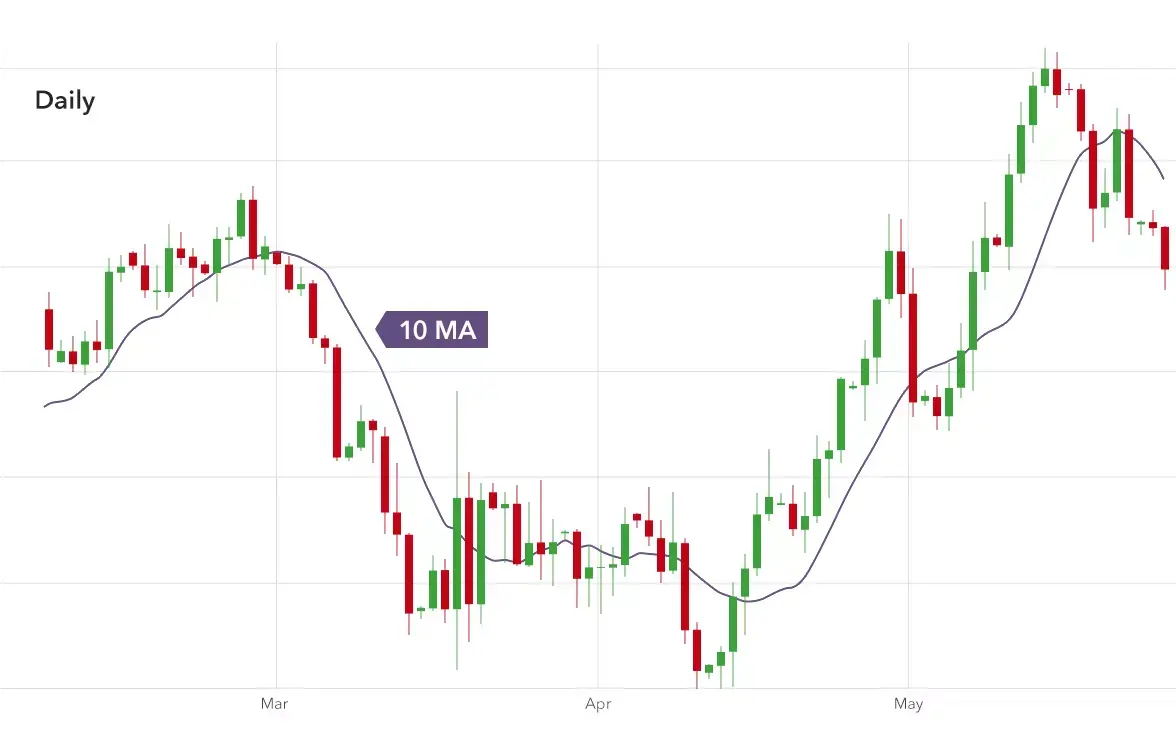
- Calculation: An SMA is calculated by adding the closing prices of the last "n" periods and dividing by "n." For example, a 50-day SMA would average the closing prices of the last 50 days.
- Weighting: SMA assigns equal weight to all data points.
- Sensitivity: SMA is less sensitive to recent price changes, making it more suitable for longer-term trends.
Exponential Moving Average (EMA)
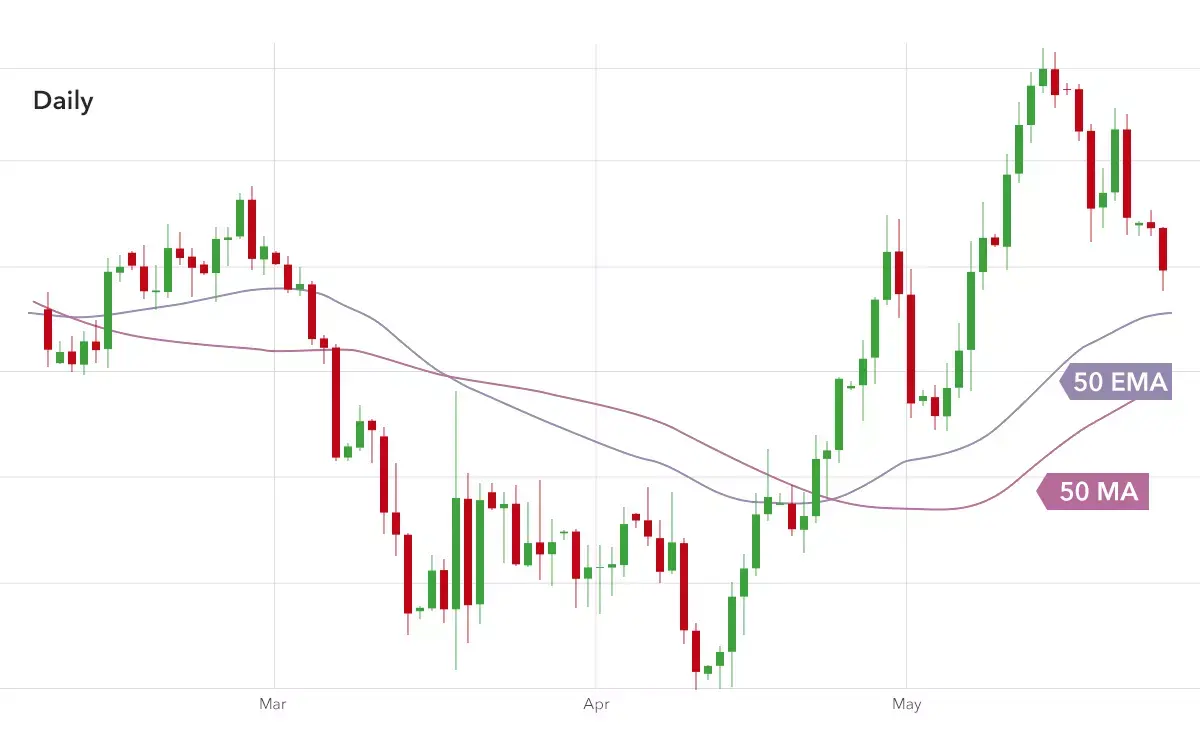
- Calculation: An EMA places more emphasis on recent prices, giving them a higher weight. The exact weighting depends on the chosen period.
- Sensitivity: EMA is more responsive to recent price changes, making it more suitable for shorter-term trends.
- Formula:
Key Differences:
- Weighting: SMA assigns equal weight to all data points, while EMA assigns more weight to recent prices.
- Sensitivity: EMA is more responsive to recent price changes than SMA.
- Use Cases: SMA is better suited for longer-term trends, while EMA is more suitable for shorter-term trends.
Choosing the Right Moving Average
The best moving average for you depends on your trading style and investment horizon. If you're interested in long-term trends, SMA might be more suitable. If you're focused on short-term trading, EMA could be a better choice. Experiment with different moving averages to find what works best for you.
Using Moving Averages
Moving averages are a popular technical indicator used to identify trends and potential turning points in the market. By understanding how to use moving averages, you can make more informed trading decisions.
Identifying Trends
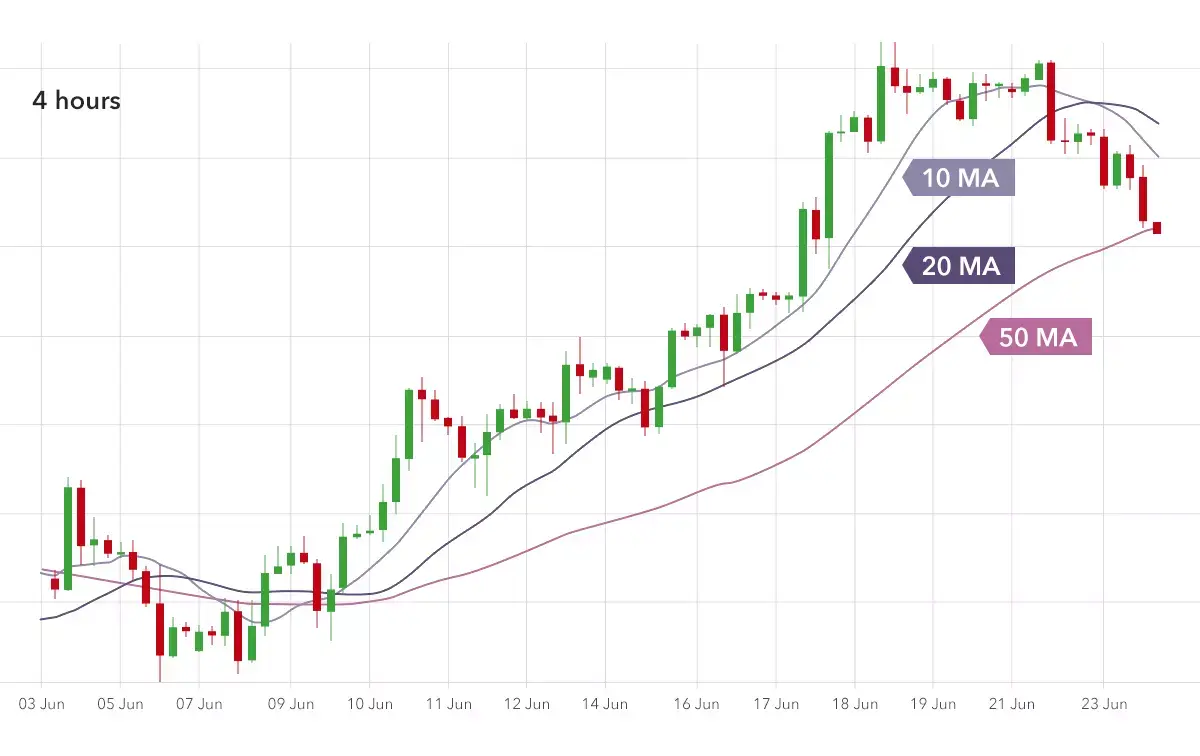
- Uptrend: In an uptrend, the shorter-period moving averages (e.g., 10-day MA) will typically be above the longer-period moving averages (e.g., 20-day MA and 50-day MA). This indicates that the price is moving higher.
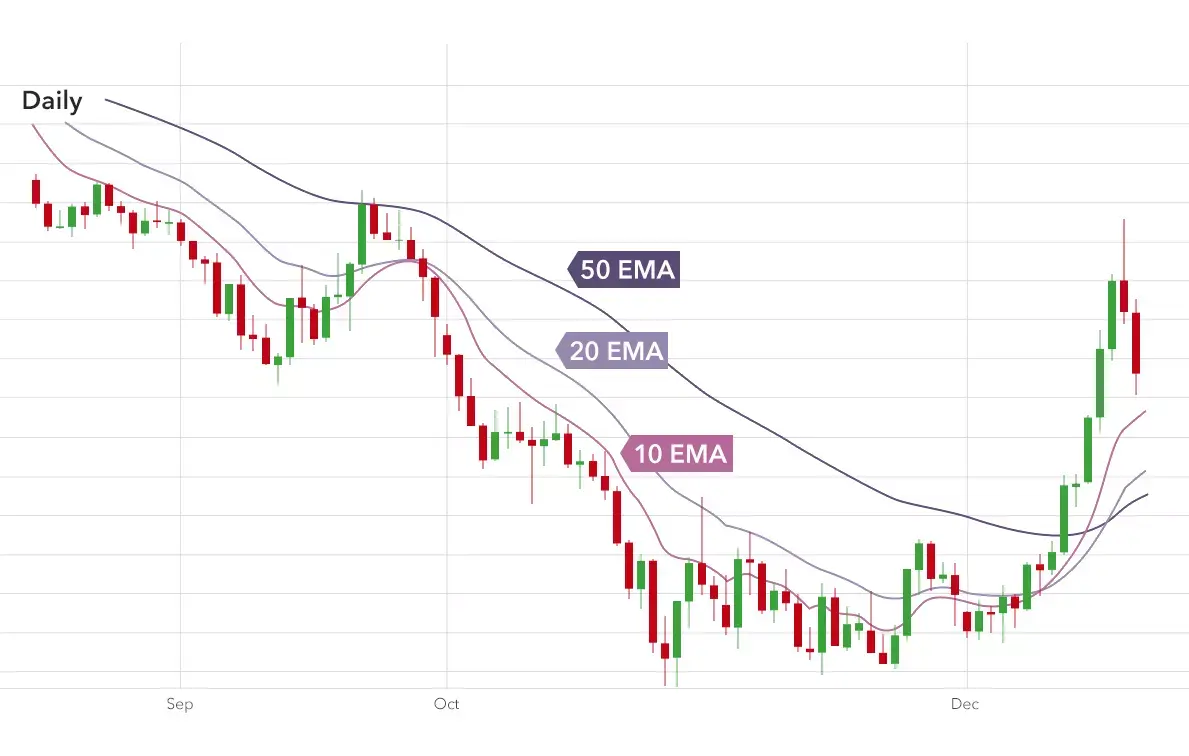
- Downtrend: In a downtrend, the longer-period moving averages will typically be above the shorter-period moving averages. This indicates that the price is moving lower.
Identify Potential Turning Points
- Dead Cross: When a shorter-period moving average crosses below a longer-period moving average, it's known as a "dead cross." This can signal a potential downtrend.
- Golden Cross: When a shorter-period moving average crosses above a longer-period moving average, it's known as a "golden cross." This can signal a potential uptrend.
Note
- Moving averages are not foolproof. They can provide valuable insights, but they should be used in combination with other technical indicators and analysis techniques.
- The choice of moving average periods (e.g., 10, 20, 50) depends on your trading style and investment horizon.
By understanding how to use moving averages, you can gain a better understanding of market trends and make more informed trading decisions.
As Support and Resistance
Moving averages can be used as dynamic support and resistance levels, just like trend lines or channels. This means they can help you identify potential areas where the price may find support or resistance.
Here's an example:
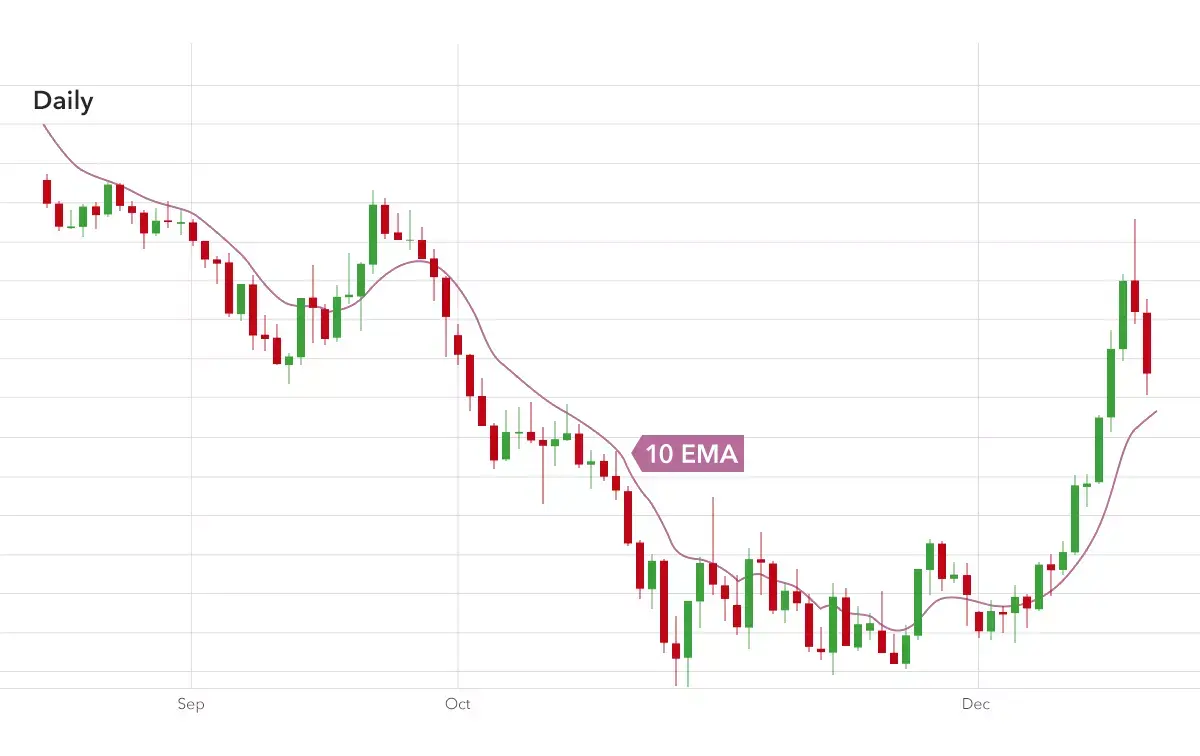
- 10 EMA as Resistance: In the chart you provided, the 10-day Exponential Moving Average (EMA) acted as a resistance level during most of the downtrend.
- Fakeout: There was a brief period in September where the price broke above the 10 EMA, but this turned out to be a false breakout (fakeout) as the downtrend continued.
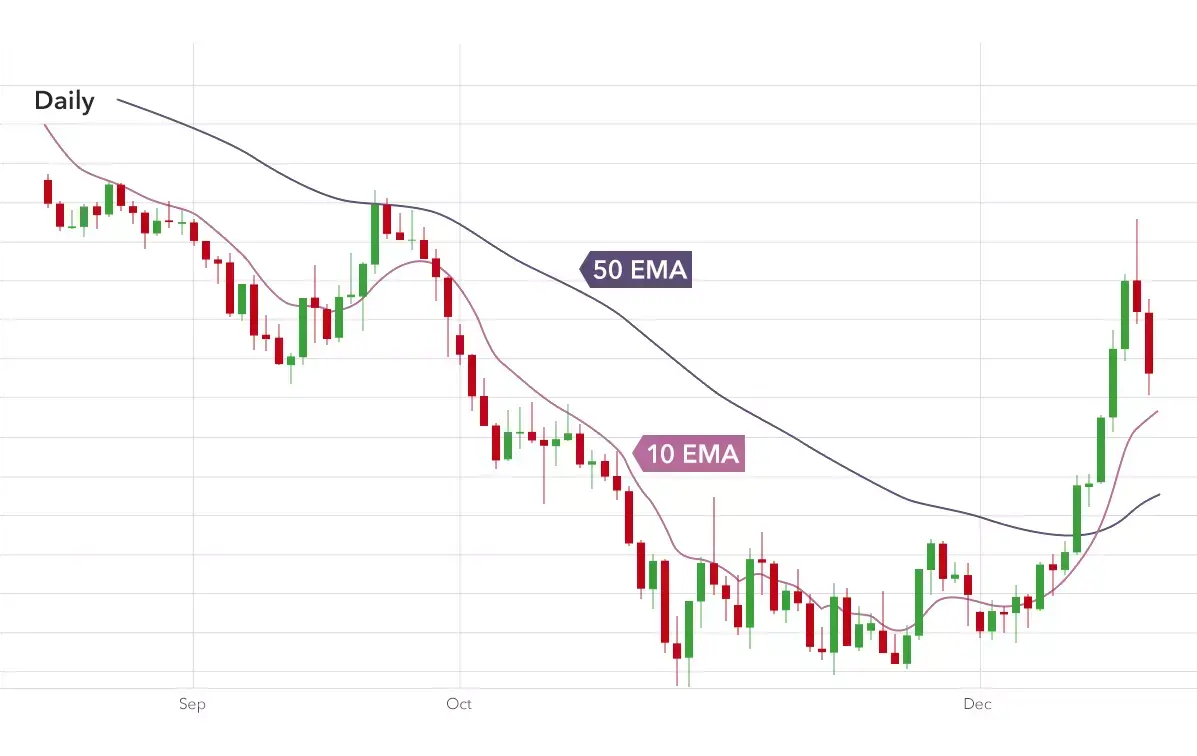
- Using Multiple Moving Averages: Adding the 50-day EMA can provide additional insights. In this case, while the 10 EMA was broken, the 50 EMA held, indicating that the downtrend was still in place.
- Crossover Signals: The intersection of moving averages can also provide signals. A crossover of a shorter-term moving average above a longer-term moving average can signal a potential uptrend.
Note
- Moving averages can be used as dynamic support and resistance levels.
- Multiple moving averages can provide additional insights and help confirm trends.
- Be cautious of fakeouts, where a price breaks through a support or resistance level but then reverses.
By using moving averages effectively, you can make more informed trading decisions and identify potential turning points in the market.